The SaaS Management page is where you review application usage data collected by the ScalePad Agent for a client. The page is made up of two tabs, Dashboard and All Apps, with a date range selector for filtering data.
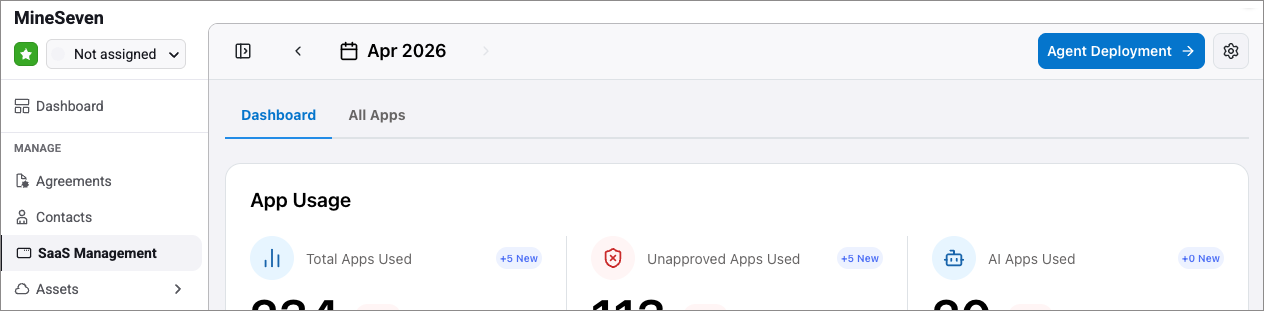
Date range selector
A date range selector in the top left of the SaaS Management page controls which data is shown across both tabs. The current selection is shown next to a calendar icon.
Click the date range selector to open the date picker. The date picker gives you three ways to select a date range:
- Quick Picks
A list of preset ranges on the left side of the picker, including This Month, Last Month, This Quarter, Last Quarter, and recent named quarters. - Monthly or Quarterly grid
Toggle between Monthly and Quarterly at the top of the picker to choose a specific month or quarter from the grid. - Custom range
At the bottom of the picker, enter a start date and an end date in the date fields.
Click Apply to apply the selected range. Click the X button to close the picker without changing the range.
Changing the date range updates the metrics, lists, and charts on both the Dashboard and All Apps tabs.
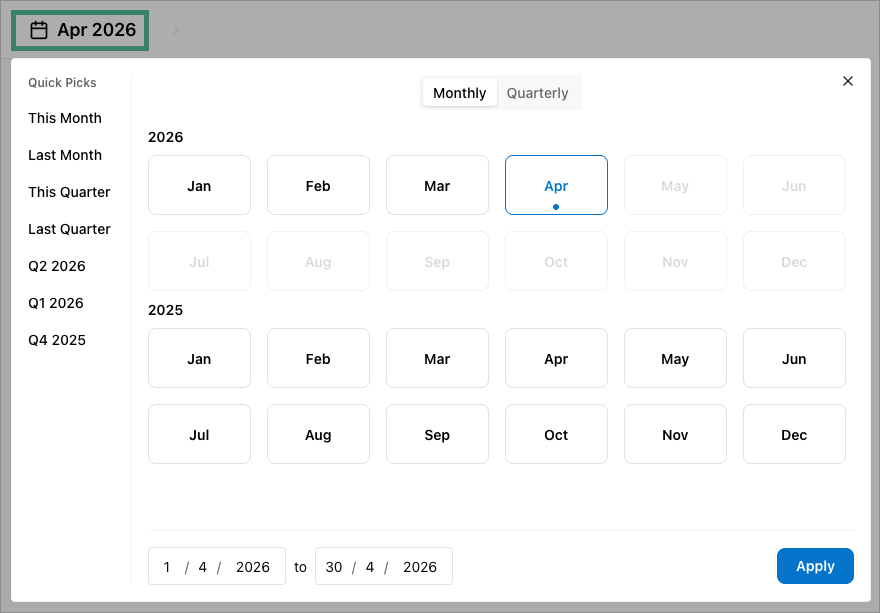
Dashboard tab
The Dashboard tab is selected by default when you open the SaaS Management page. It provides a high-level view of application usage across the client's environment, organized into the following panels. In any panel that shows a list of applications, you can click an application name to open the app details drawer. For more details on the drawer, see the App details drawer section later in this article.
App Usage
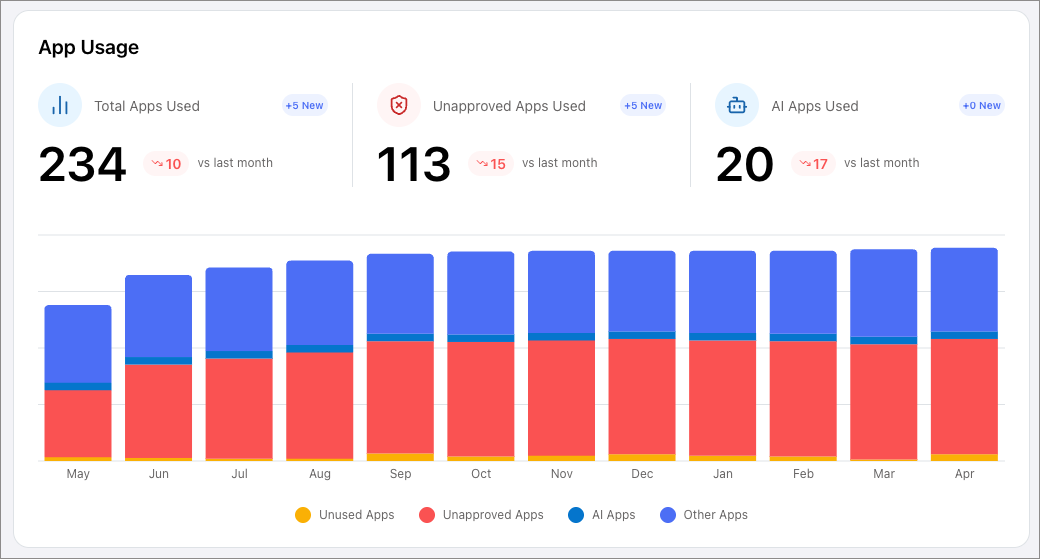
The App Usage panel shows three metrics at the top:
- Total Apps Used
The total number of unique applications used across the client's environment during the selected date range. - Unapproved Apps Used
The number of applications used that have not been approved. - AI Apps Used
The number of AI applications used.
A bar chart below the metrics shows application usage over the last 12 months.
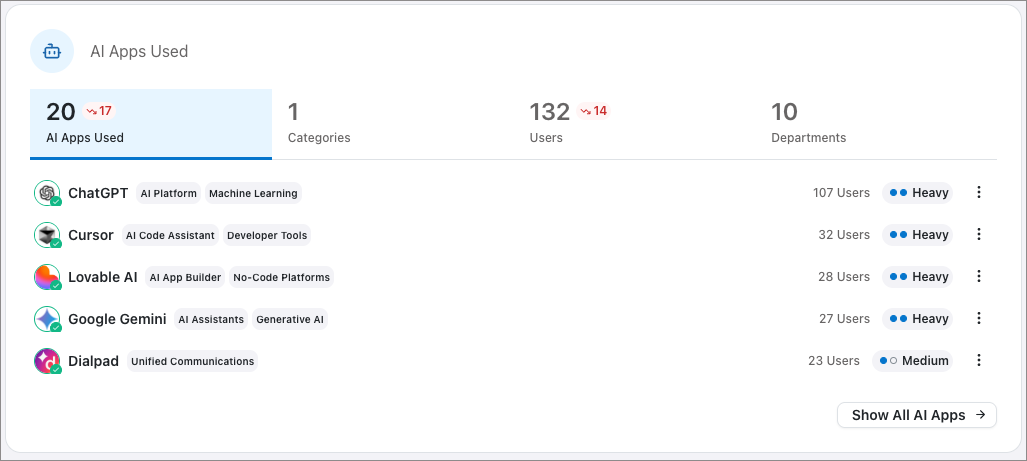
AI Apps Used
The AI Apps Used panel provides a summary of AI application usage during the selected date range. The panel is divided into four views, each shown as a tab at the top of the panel. Each tab displays a count, and some show a trend indicator comparing the count to the previous period.
- AI Apps Used
The total number of AI applications used. Shows a list of the most-used AI applications, along with their categories, the number of users, and a usage indicator (for example, Heavy or Medium). Click Show All AI Apps to view the full list. - Categories
The number of AI application categories in use. Shows the most-used categories, along with the number of users and a bar chart representing relative usage. - Users
The total number of users using AI applications. Shows the top users, along with the number of apps each user uses. - Departments
The number of departments using AI applications. Shows the top five departments, along with the number of users and apps in each.
Unapproved Apps Used
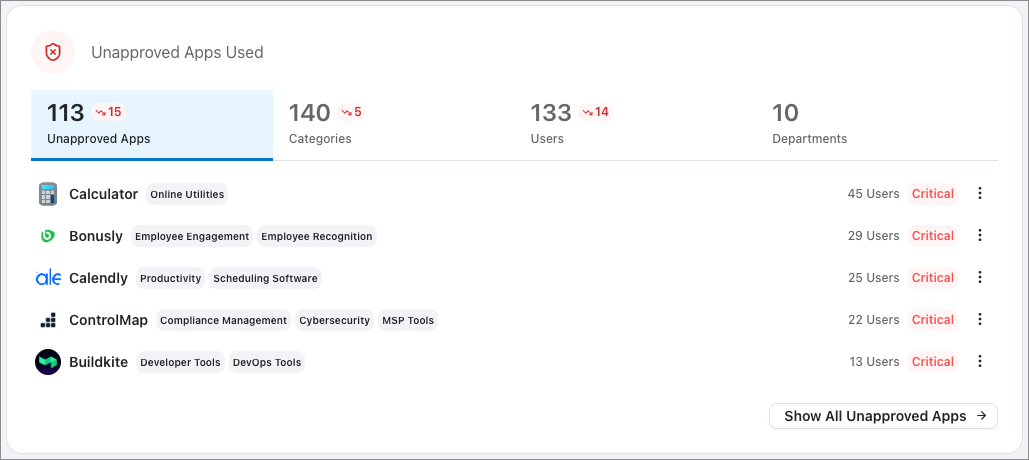
The Unapproved Apps Used panel shows applications used during the selected date range that have not been approved. It follows the same layout as the AI Apps Used panel, with four tabs at the top:
- Unapproved Apps
Shows the most-used unapproved applications and their usage indicators. Click Show All Unapproved Apps to view the full list. - Categories
The most-used categories of unapproved applications. - Users
The top users, based on the number of unapproved applications they use. - Departments
The top five departments using unapproved applications.
Top Apps
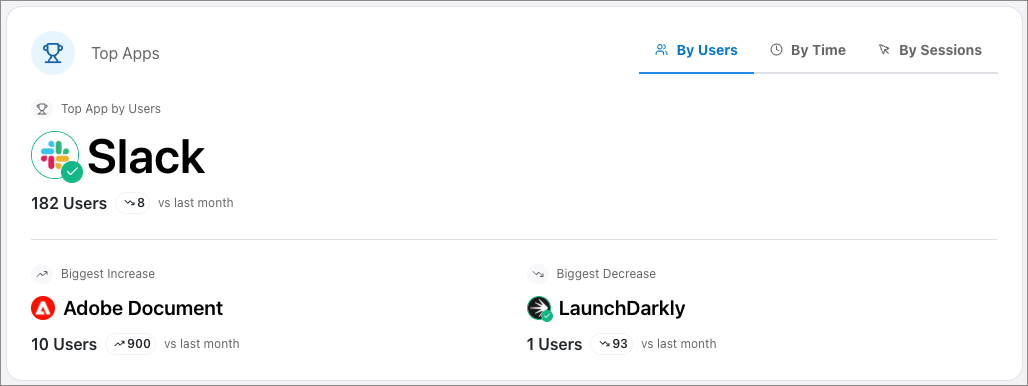
The Top Apps panel highlights the top-performing application for the selected date range, along with the applications that saw the biggest increase and biggest decrease in usage compared to the previous period.
The panel has three tabs for ranking:
- By Users
Ranked by the number of unique users. - By Time
Ranked by the amount of time spent in each application. - By Sessions
Ranked by the number of sessions.
For the selected ranking, the panel shows:
- Top App
The highest-ranked application, along with its metric value and a trend indicator comparing it to the previous period. - Biggest Increase
The application with the largest increase in the selected metric, along with its metric value and a trend indicator. - Biggest Decrease
The application with the largest decrease in the selected metric, along with its metric value and a trend indicator.
New Apps This Month
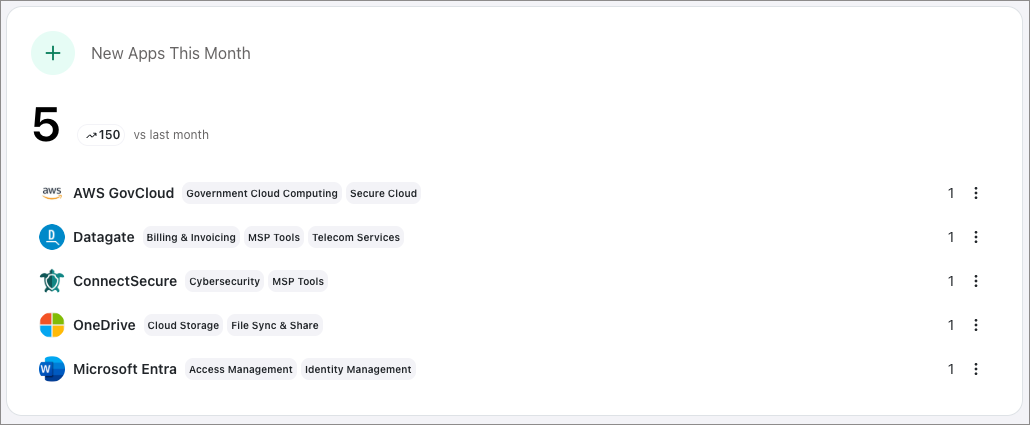
The New Apps This Month panel shows applications that were newly installed or reported by the ScalePad Agent during the selected date range. The panel displays:
- A count of new applications.
- A trend indicator showing the change compared to the previous period.
- A list of the new applications, along with their categories and the number of unique users.
Each application in the list has a context menu that you can use to approve or un-approve it.
Unused Apps This Month
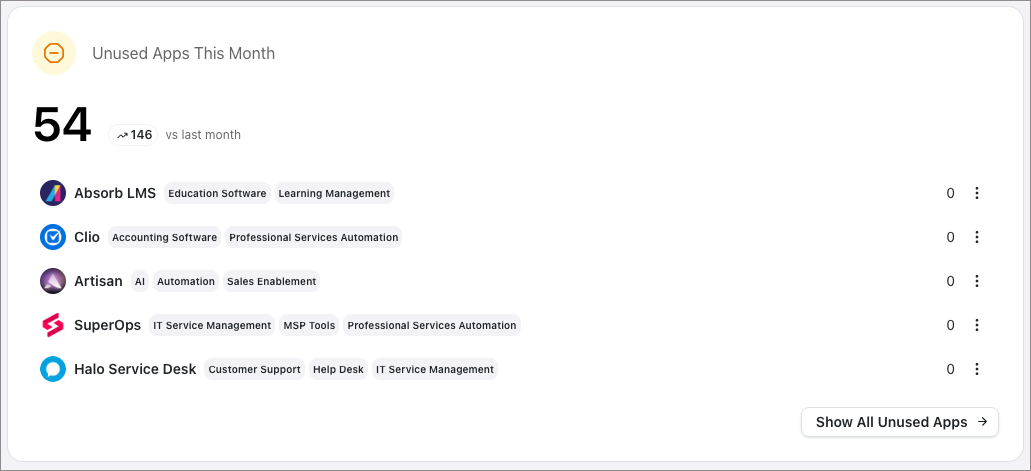
The Unused Apps This Month panel shows applications that are not actively being used during the selected date range, including both approved and unapproved applications with zero usage. Use this panel to identify license optimization opportunities, such as applications you may be paying for that your client no longer needs. The panel displays:
- A count of unused applications.
- A trend indicator showing the change compared to the previous period.
- A list of the unused applications, along with their categories and the number of unique users.
Each application in the list has a context menu that you can use to approve or un-approve it.
All Apps tab
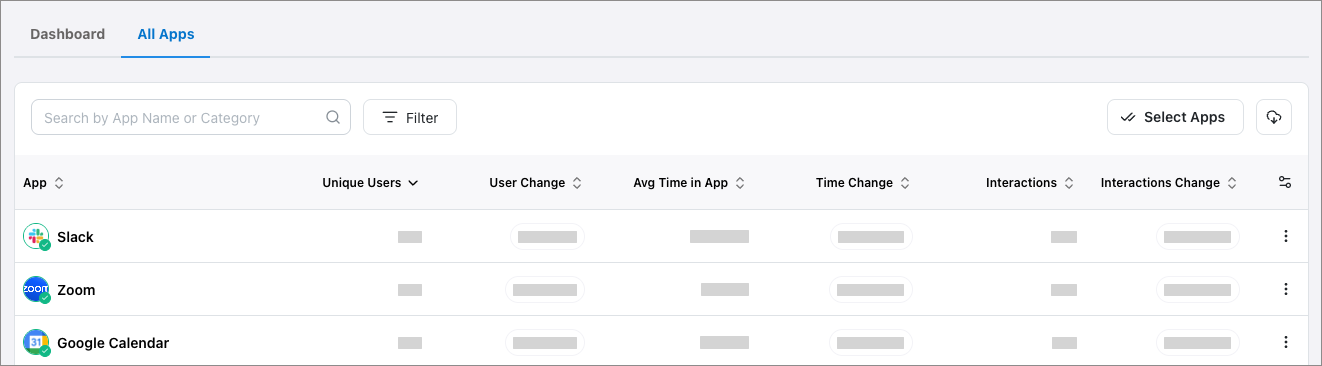
The All Apps tab displays a table of all applications detected across the client's devices during the selected date range. You can filter the table, sort by any column, open an app to view usage details, approve and un-approve apps individually or in bulk, and export the table as a CSV file.
Columns
The All Apps table has the following columns:
- App
The name of the application. - Unique Users
The number of unique users who used the application during the selected date range. - User Change
The percentage change in unique users compared to the previous period. - Avg Time in App
The average amount of time each user spent in the application. - Time Change
The percentage change in average time compared to the previous period. - Interactions
The number of interactions with the application. - Interactions Change
The percentage change in interactions compared to the previous period.
Click any column header to sort the table by that column.
The final column, marked with the Actions icon ( ), contains a context menu for each row. Click the menu to approve or un-approve the application.
Searching and filtering
Above the table, you can search for a specific application or filter the list:
- Search bar
Search by application name or category. - Filter button
Opens a menu with filtering options. - Lifecycle
Filter by New Apps or Unused Apps. - Approval
Filter by Approved or Not Approved. - Department
Filter by any department in the client's environment. - App Category
Filter by application category.
Selecting and approving apps in bulk
To approve or un-approve multiple applications at once:
- Click Select Apps in the top right of the table.
- Click each application you want to approve or un-approve.
- In the bar at the bottom of the page, click Approve or Un-Approve.
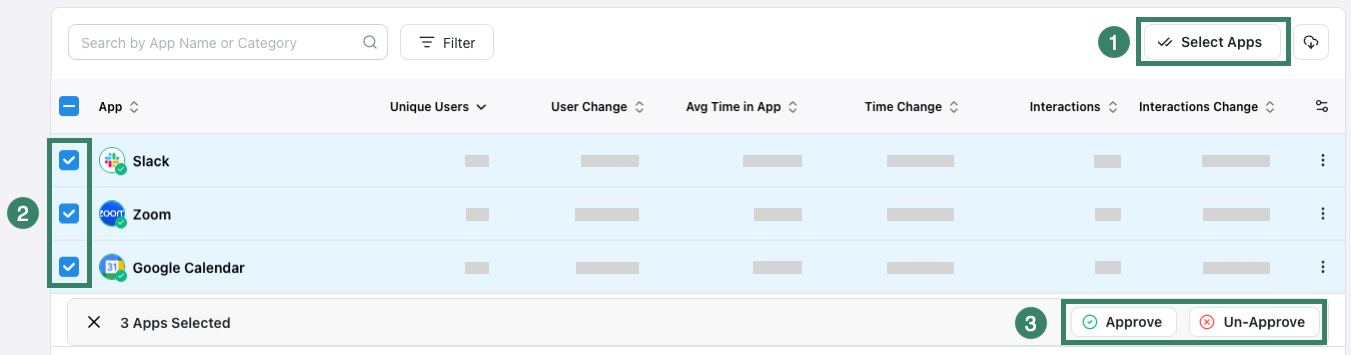
Approved/Un-Approved status will be applied to all of the apps that were selected.
Exporting the table
To export the All Apps table as a CSV file, click the Export button ( ) in the upper right of the list.
The CSV includes the data visible in the table.
App details drawer
Click any row in the All Apps table to open the app details drawer. The drawer shows detailed information about the selected application, organized into the following sections:
Header
At the top of the drawer, the following information and controls are shown:
- The application name.
- Whether the application is approved or unapproved.
- A department selector (Defaults to All Departments).
- A date range selector for the data shown in the drawer.
Usage Trends
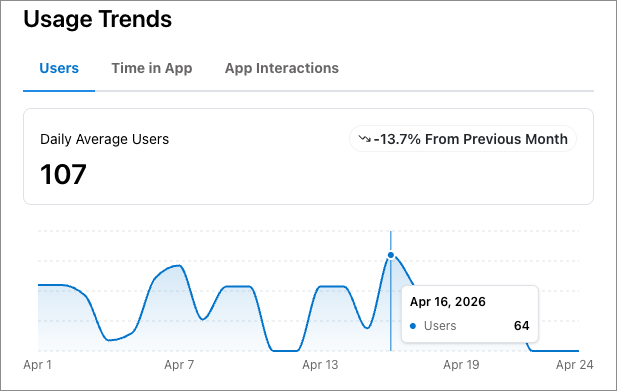
The Usage Trends section shows how the application has been used during the selected date range. Three tabs let you change what data is shown:
- Users
Shows the daily average number of users. - Time in app
Shows the daily average time spent in the application. - App Interactions
Shows the daily average number of interactions.
Each tab shows the metric, the percentage change compared to the previous period, and a line chart of the selected metric over the selected date range.
Top App Users
The Top App Users section shows the top five users of the application, with the following columns:
- User
The user's name. - Avg Daily Time
The average amount of time per day the user spent in the application. - Change
The percentage change compared to the previous period. - Days per Month
The number of days in the month the user used the application.
Click Show all Users to see the full list.
App History
The App History section shows a timeline of approval activity on the application and any comments that have been added.
Click the Add a Comment button to add a note to the app, which will remain timestamped and visible in the app history section.
About
The About section shows background information about the application:
- Description
A short description of the application. - Vendor
The company that makes the application. - Website
A link to the vendor's website. - Date Added
The date the application was added to the ScalePad app catalog. - Categories
The categories the application belongs to. - Web URLs
The web domains the ScalePad Agent tracks for this application. - Desktop Identifiers
The desktop application identifiers the ScalePad Agent tracks for this app.
Agent Deployment and Settings
Two buttons in the top right of the SaaS Management page open other pages related to SaaS Management:
- Agent Deployment
Generate enrollment tokens and review the status of deployed devices and users. For more details, see this article:
Deploying the SaaS Management agent
- Settings
The settings icon in the upper right of the screen ( ). Contains options to change the data collection mode and manage departments. For more details, see:
Configuring SaaS Management settings
Note
Any questions? Reach out to our Lifecycle Manager support team by submitting a support ticket.
Note
:sparkles: NEW :sparkles: Join our MSP Power-Ups - Free 15-minute micro-workshops + live Q&A with our Lifecycle Manager experts. Sign up here to reserve your spot.